Live network · 14,382 shipments in transit

Ensuring on-time delivery across complex supply chains.

Meridian is the reliability partner for manufacturers, distributors, and global brands. We engineer freight, warehousing, last-mile, and customs into one measurable operation — tracked in real time, accountable to your P&L.
99.4%
On-time delivery (rolling 30d)
−21%
Avg. landed cost reduction
142
Ports & terminals served
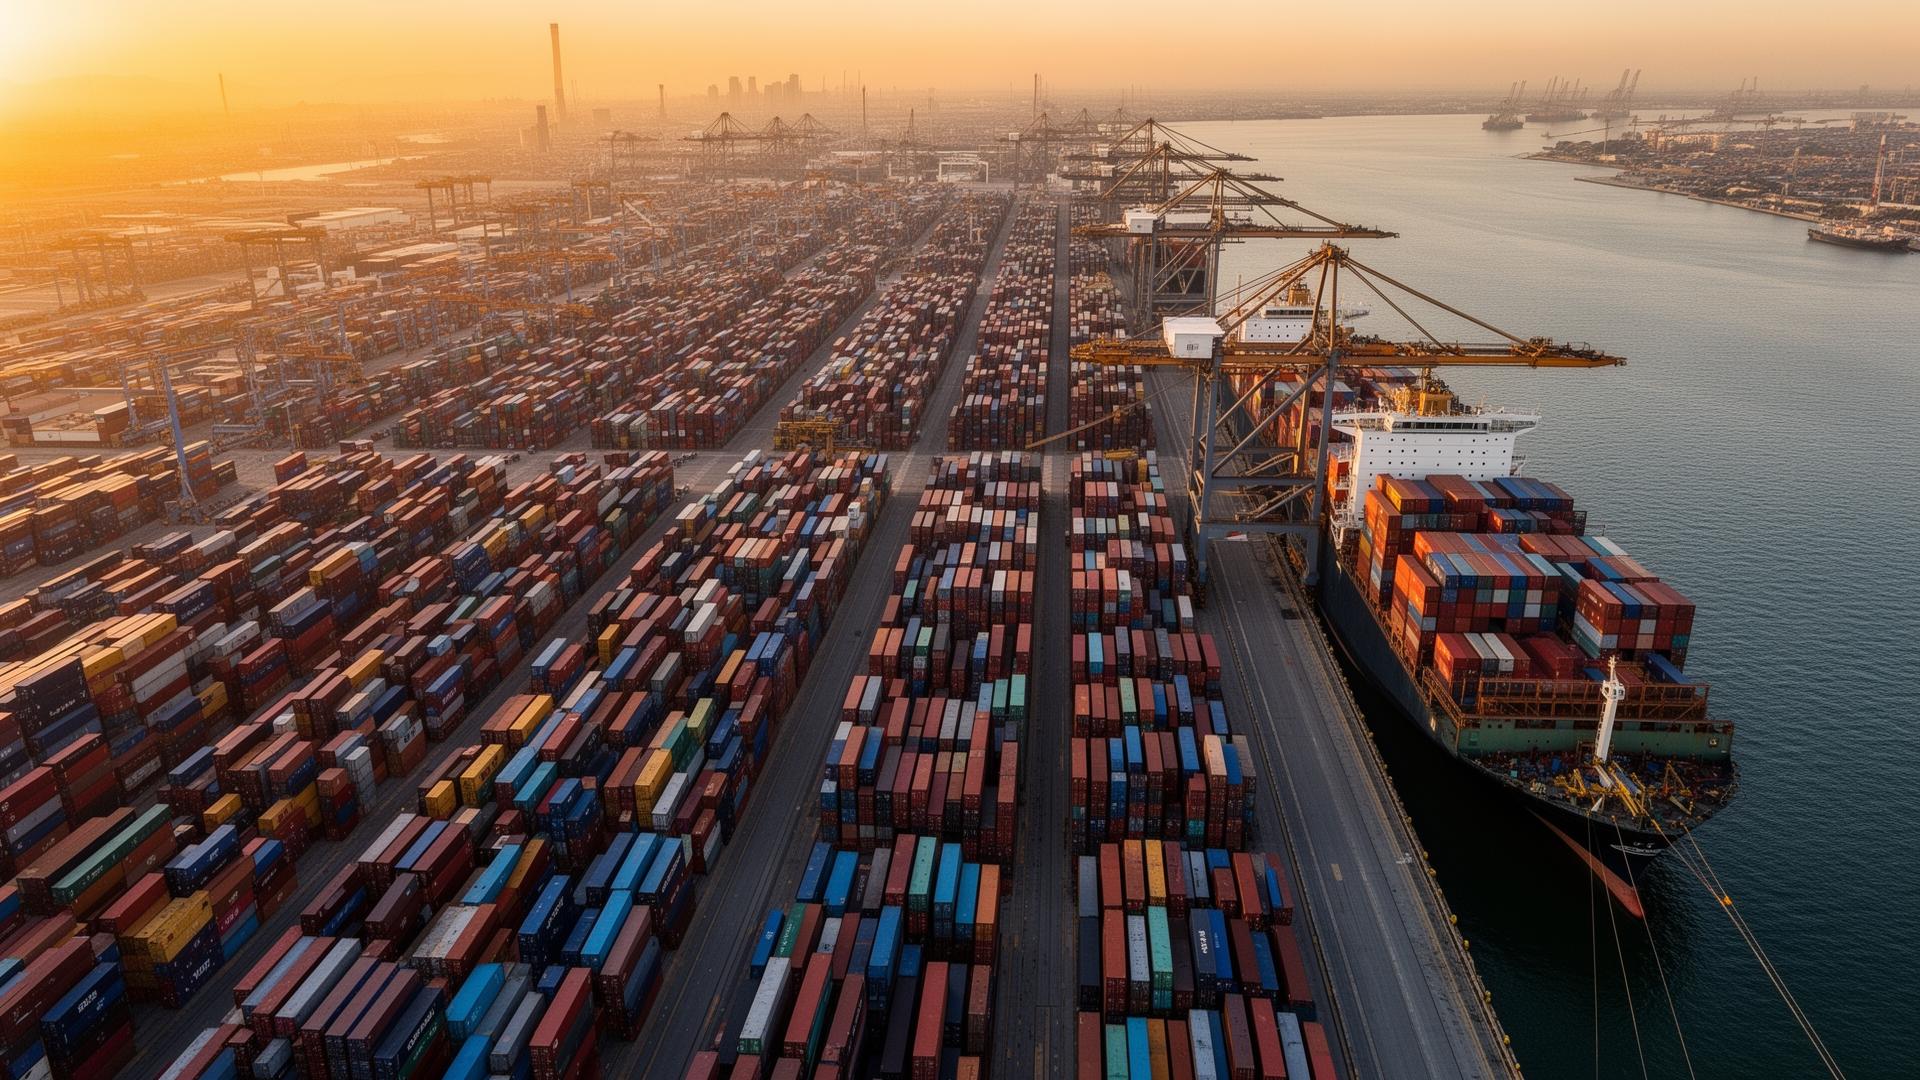
Aerial view of a container port with stacked shipping containers and cargo ship at dock
Shipment MRD-48217In transit · on schedule
Origin
Rotterdam, NL
Dest.
Jakarta, ID
ETA
Mar 14 · 09:20

Trusted by manufacturers, distributors & global brands

NESTLÉUNILEVERSCHNEIDERPHILIPSDANONEBOSCHP&GSHOPEEASTRAMAERSKNESTLÉUNILEVERSCHNEIDERPHILIPSDANONEBOSCHP&GSHOPEEASTRAMAERSK
01 — Industry reality

Supply chains break in the gaps between vendors — that is where cost and trust leak.

We measured 4,200+ B2B lanes across FMCG, manufacturing and e-commerce. Six failure modes account for nearly every missed delivery and inflated invoice.

Failure mode
27% of B2B freight

Delayed shipments

arrives outside the agreed window, eroding production schedules and downstream SLAs.

Failure mode
Avg. 3.4 days dark

No tracking visibility

between port handoffs — customers escalate before you know there is an exception.

Failure mode
1.8% of pallets

Damaged goods

lost or damaged in transfer due to mishandling at unmonitored break-bulk points.

Failure mode
Up to 18% deadhead

Inefficient routing

miles in last-mile fleets — burning fuel, driver hours, and CO₂ for zero revenue.

Failure mode
9–14% of COGS

High logistics cost

swallowed by fragmented vendors, surcharges, and untracked accessorial fees.

Failure mode
11 days avg.

Customs friction

in clearance delays from misclassified HS codes and missing documentation.

02 — How we fix it

Every service mapped to a problem, measured by a number.

All services
Case 01
Problem
Frequent late deliveries on inbound raw materials
Solution
Multi-modal route engineering with dynamic ETAs and carrier scorecards updated nightly.
Result
On-time delivery improved from 78% → 96.4% across 11 Asia–EU lanes.
Case 02
Problem
No visibility once cargo leaves the origin port
Solution
GPS + IoT sensors stream temperature, shock and dwell into a unified shipment timeline.
Result
Mean time-to-exception cut from 38h to 42 minutes.
Case 03
Problem
Last-mile costs rising 14% YoY in dense urban zones
Solution
AI-clustered delivery windows + electric fleet for sub-15km drops, fixed-rate pricing.
Result
Cost-per-parcel reduced 23%, CO₂ per drop down 41%.
Case 04
Problem
Customs holds eating 7–11 days off launch windows
Solution
In-house licensed brokers, pre-arrival lodgement, HS classification audited per SKU.
Result
Clearance time reduced to 28 hours average across 6 ASEAN markets.
03 — Service stack

One operator, one SLA — from factory floor to customer doorstep.

Each service is staffed by domain operators, instrumented end-to-end, and contracted against measurable outcomes — not effort.
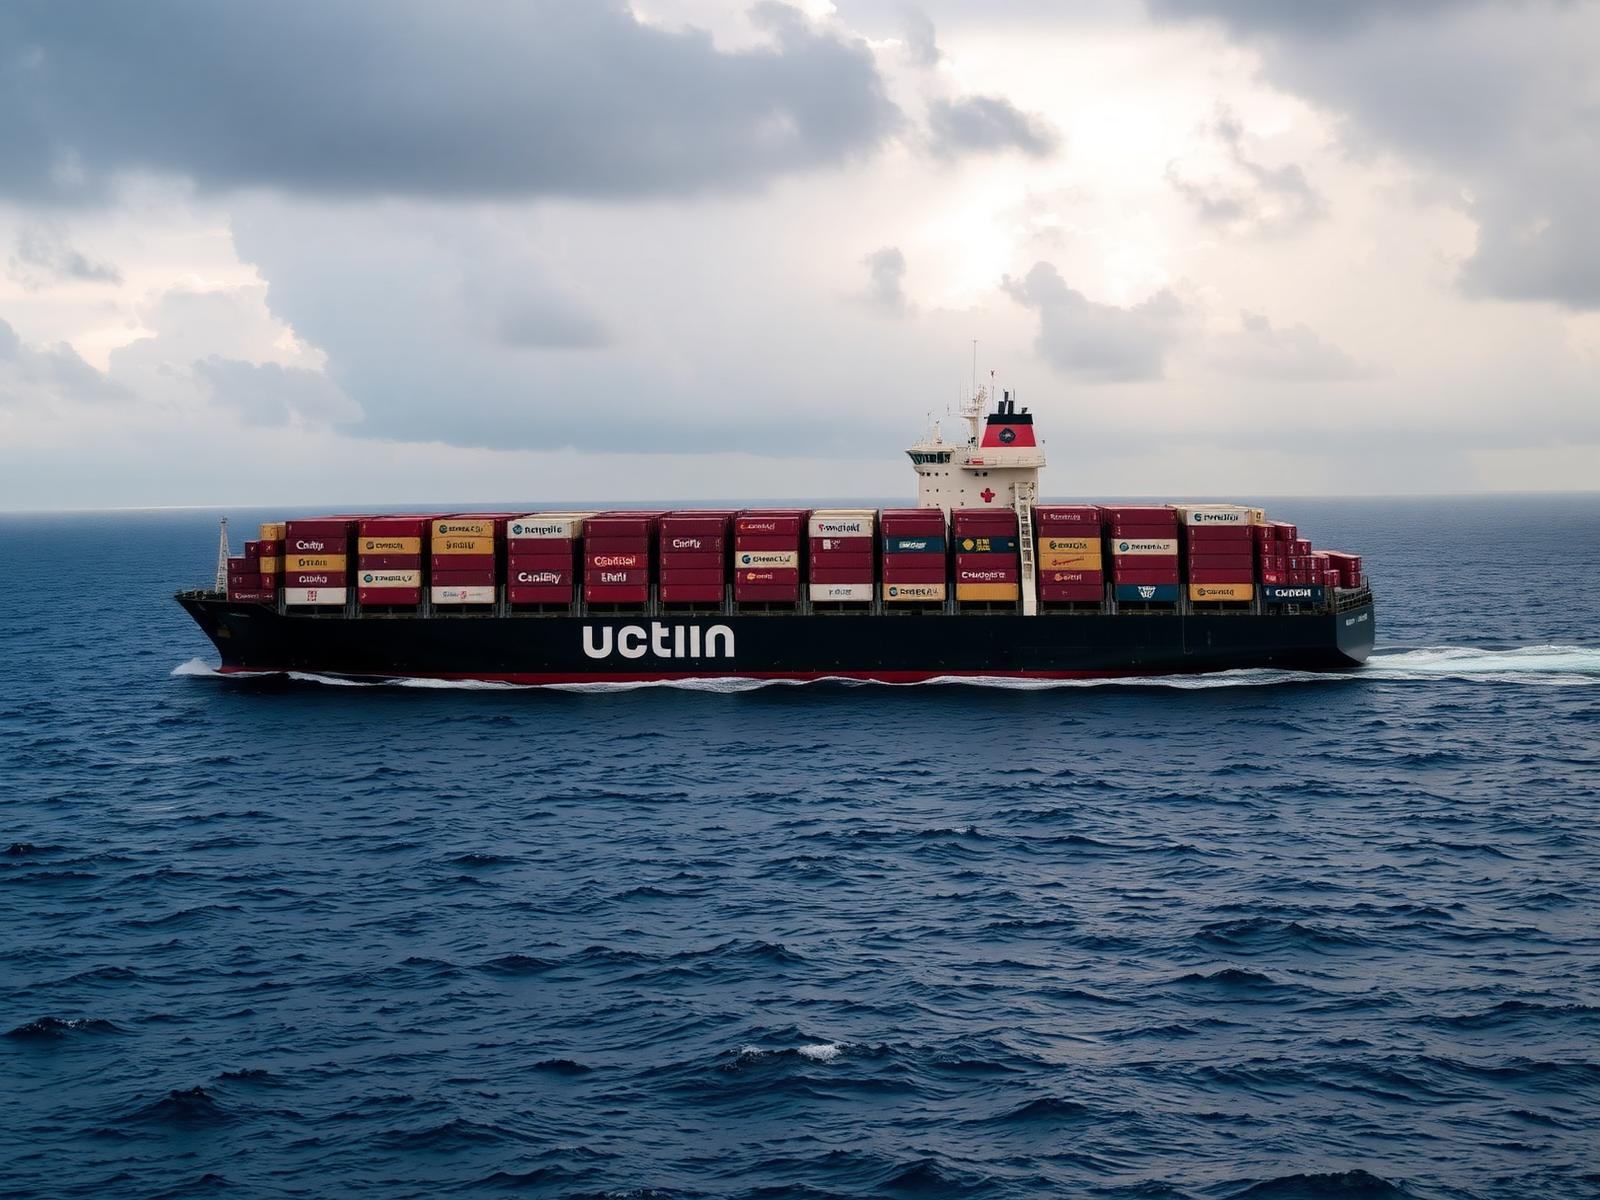
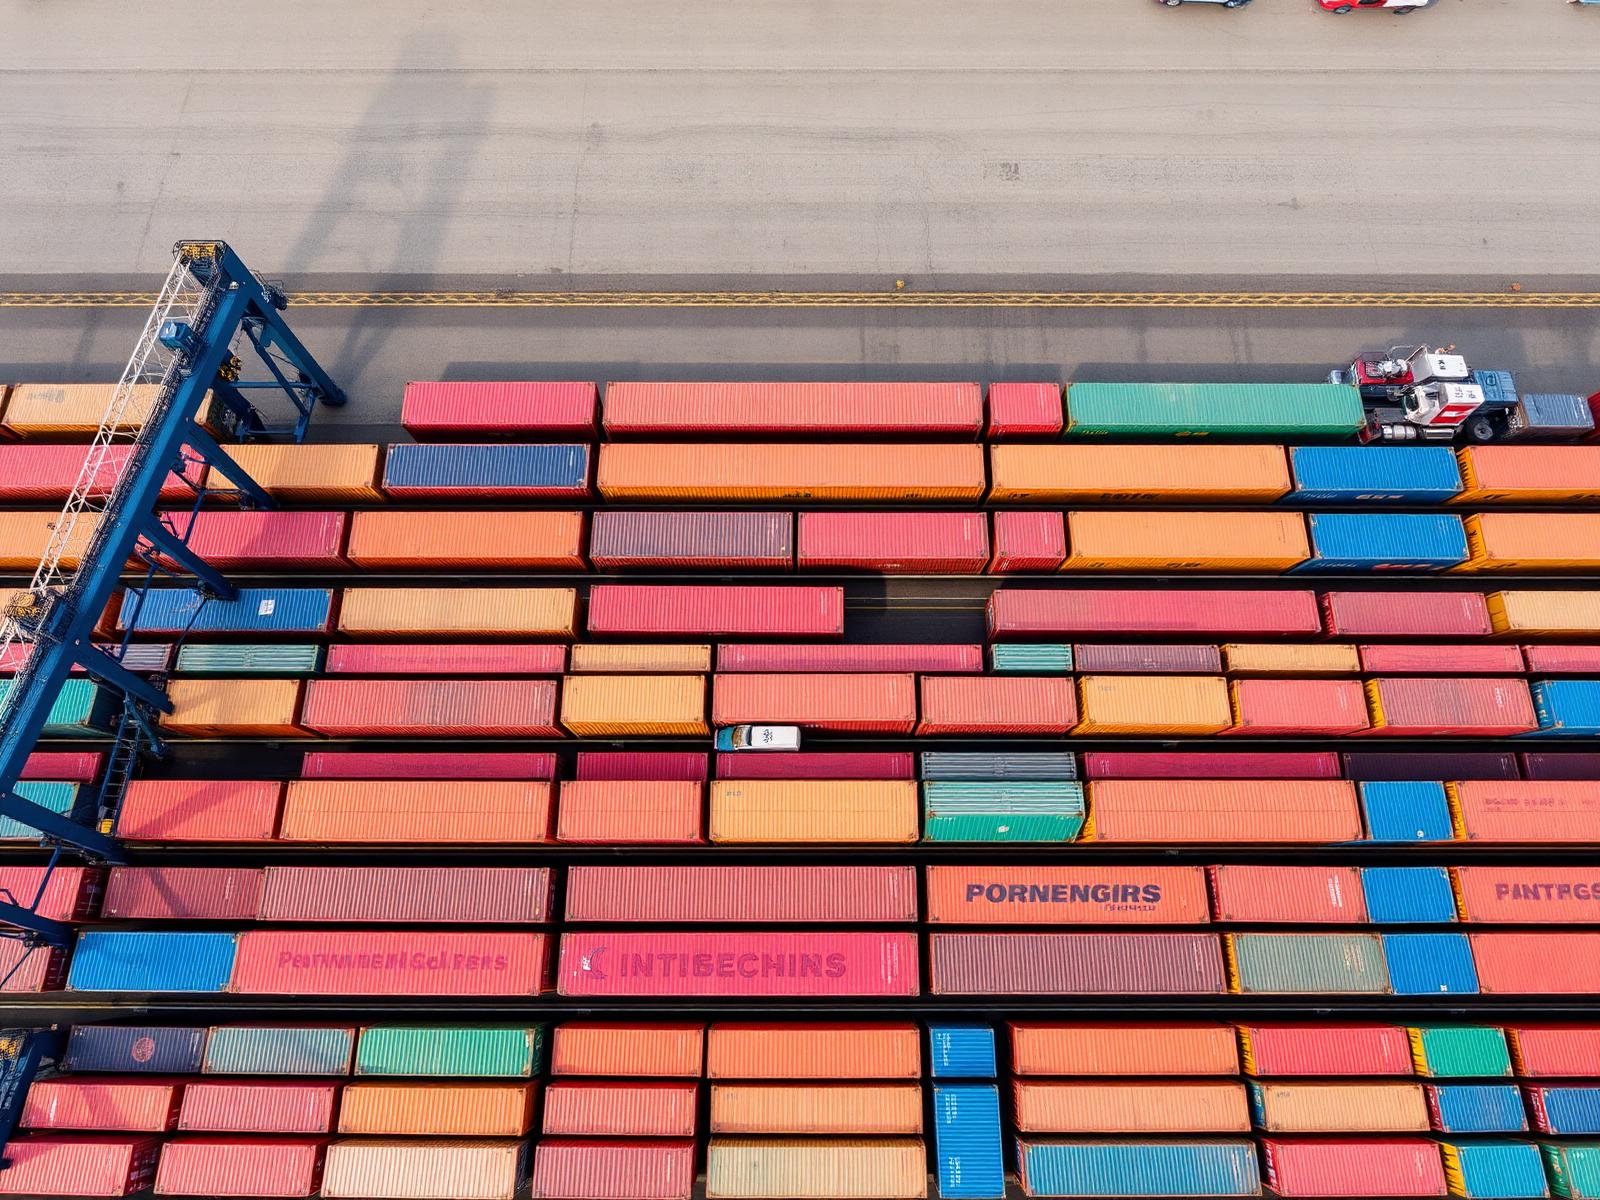
Freight Forwarding — operational photograph

Freight Forwarding

Air · Sea · Multi-modal

Lane-level on-time rate up to 99.1%, with consolidated documentation per shipment.
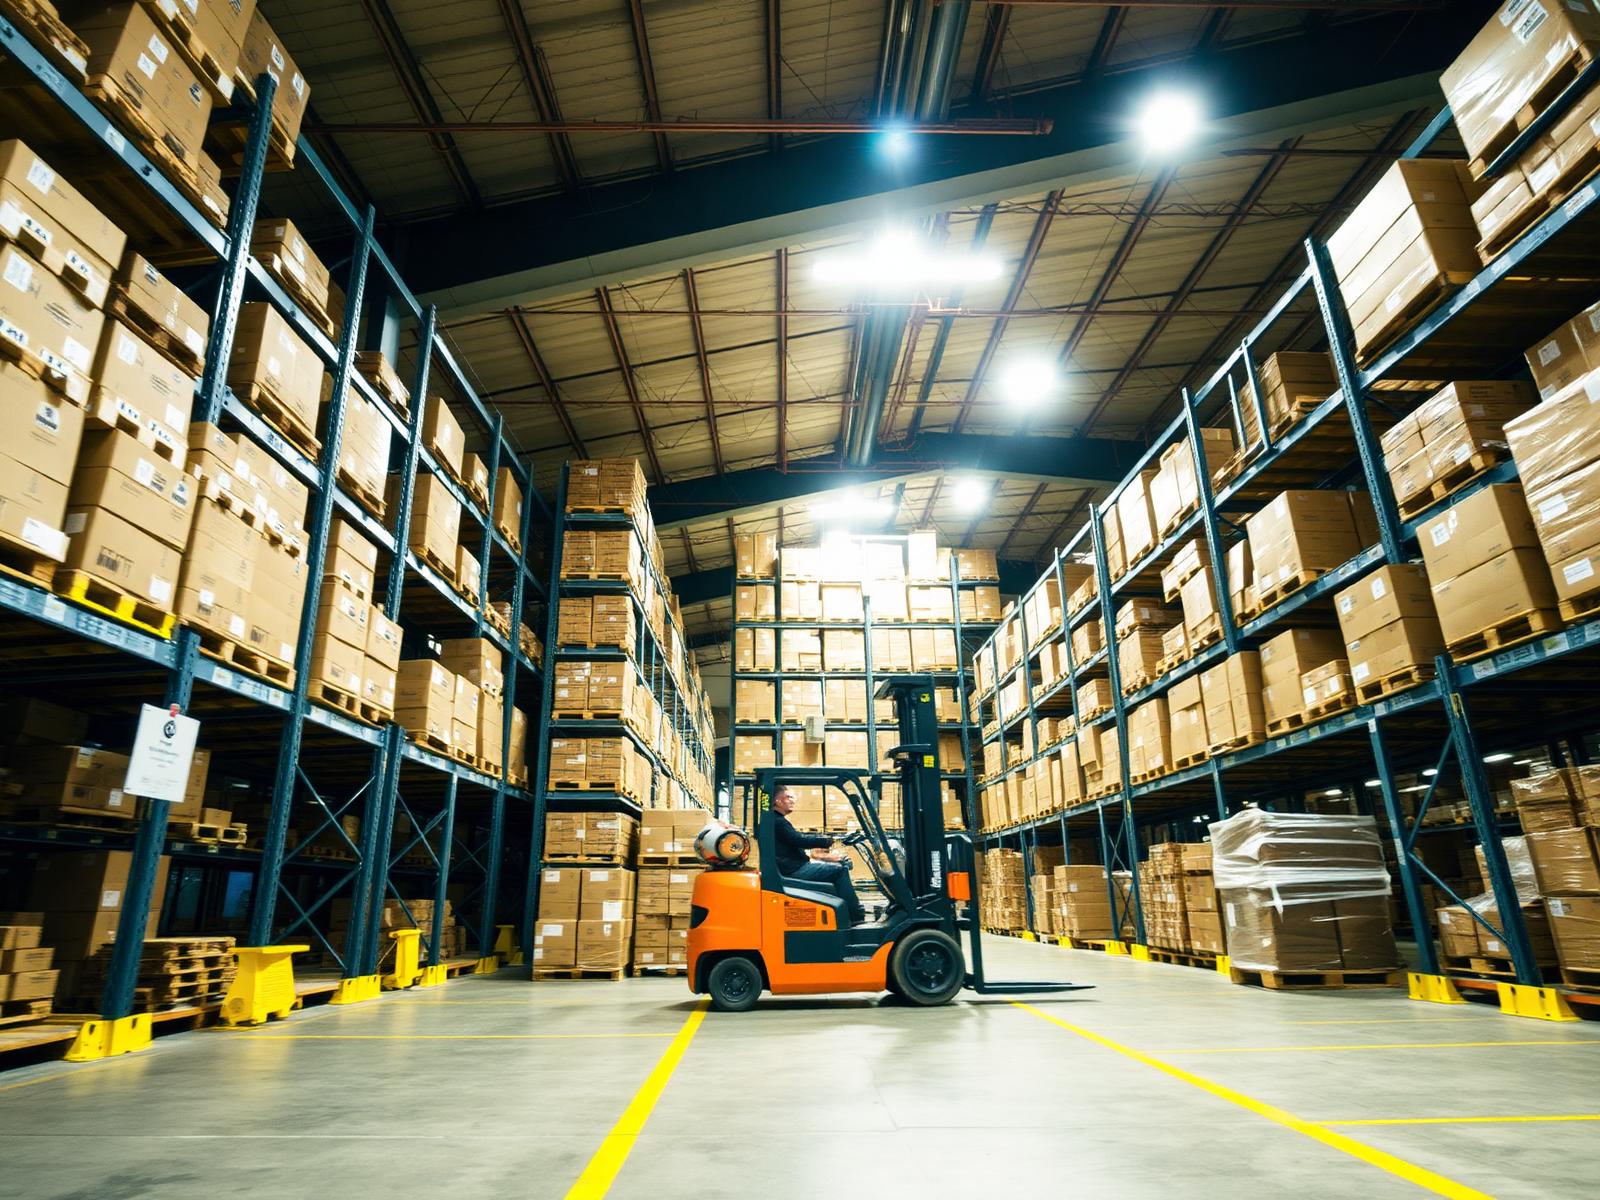
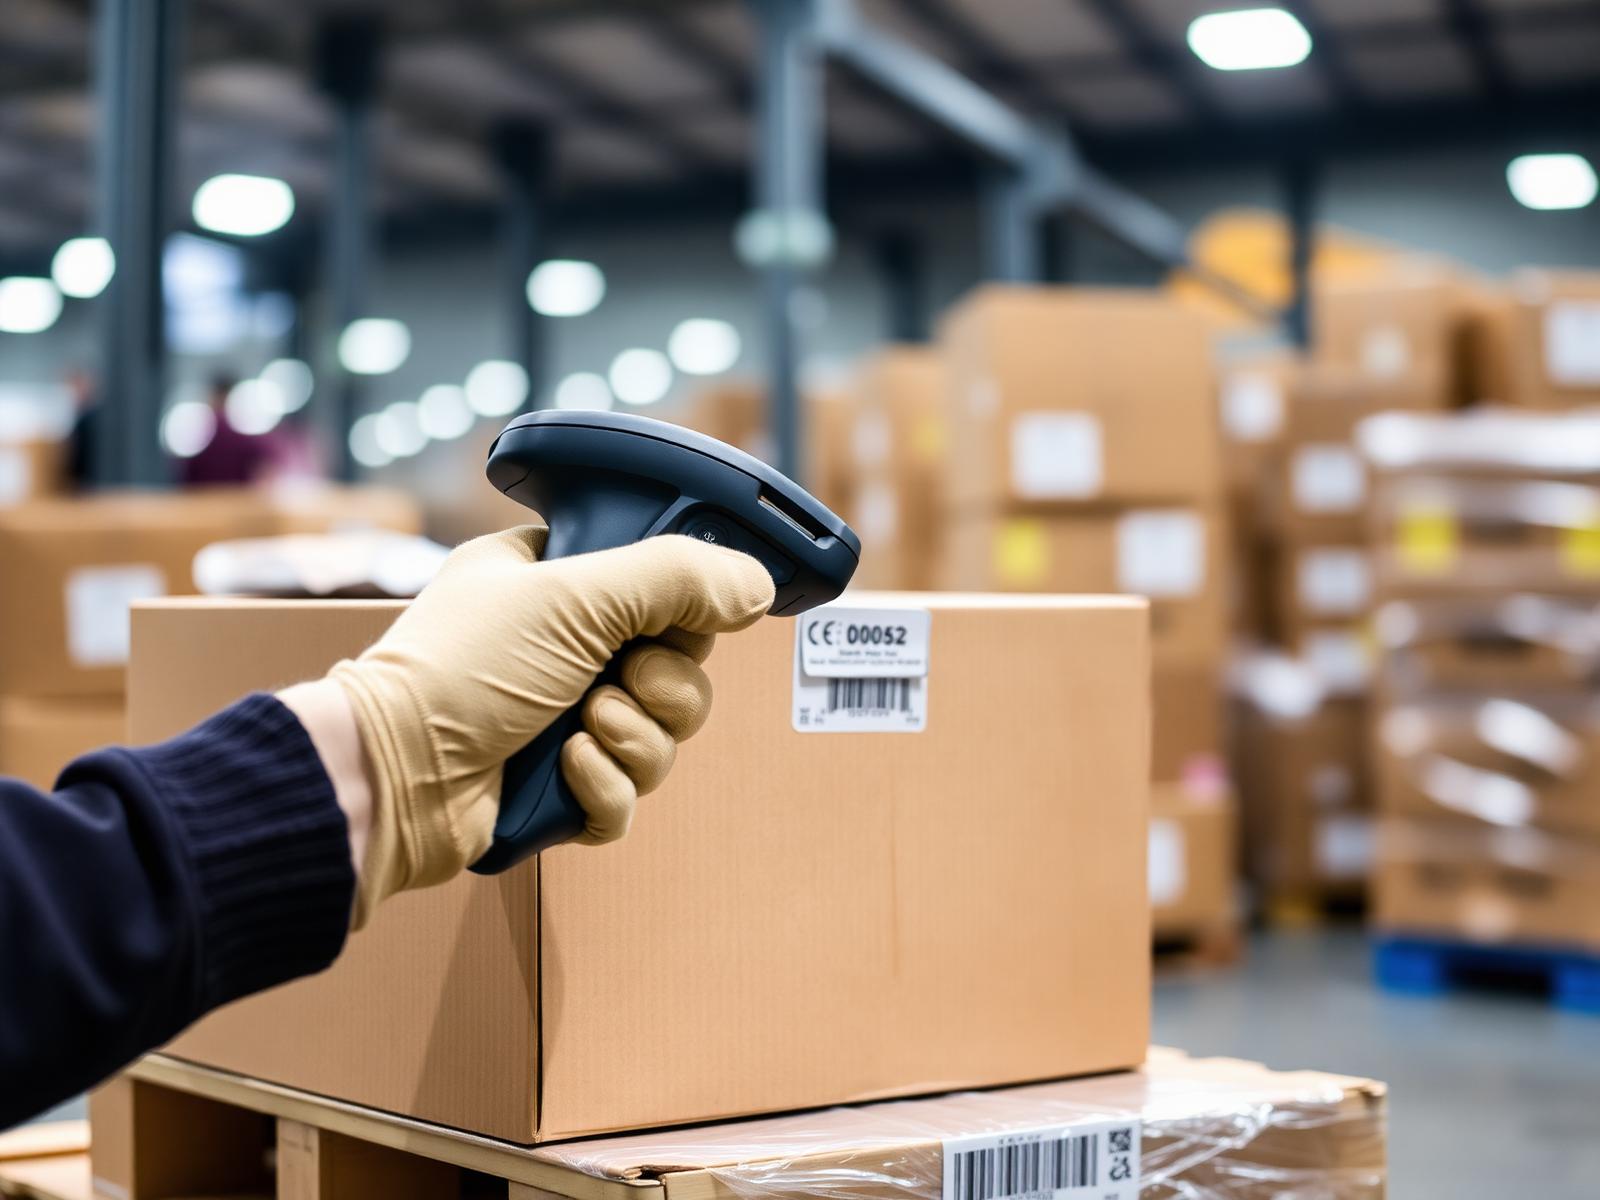
Warehousing & 3PL — operational photograph

Warehousing & 3PL

Bonded · Ambient · Cold chain

Pick accuracy 99.96%, dock-to-stock under 4 hours across 38 facilities.
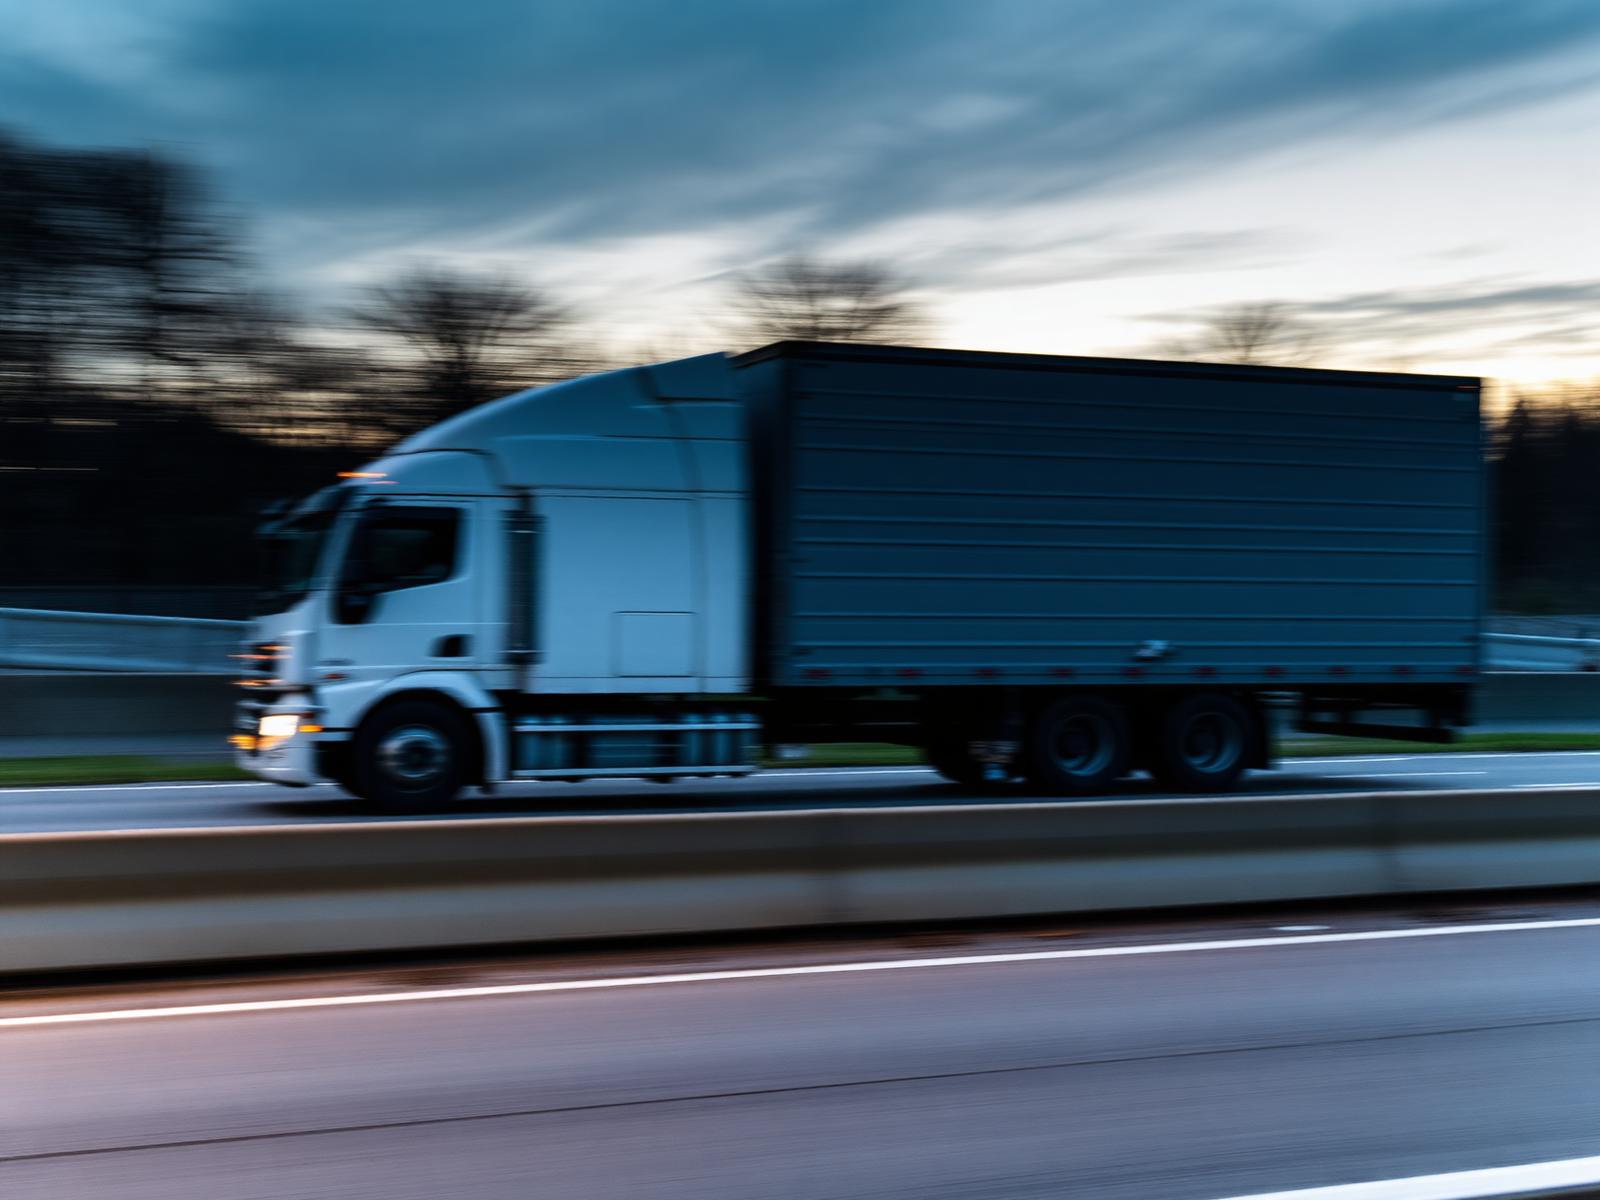
Last-Mile Delivery — operational photograph

Last-Mile Delivery

B2B · D2C · Reverse logistics

Same-day windows in 64 cities; first-attempt success rate 97.2%.
Supply Chain Optimization — operational photograph

Supply Chain Optimization

Network design · S&OP

Avg. 21% reduction in landed cost within 9 months of engagement.
Customs Clearance — operational photograph

Customs Clearance

Licensed brokers · 14 countries

Clearance in 28 hours avg., zero penalty audits in 36 consecutive months.

04 — Visibility platform

One dashboard for every shipment, sensor and exception.

Live GPS, IoT condition data, ETAs and cost-per-shipment, surfaced where your ops, finance and customer teams already work — Slack, SAP, NetSuite, or our web console.

  • Real-time shipment lat/long updated every 90 seconds
  • Temperature, humidity, shock and door-open events per pallet
  • Auto-routed exceptions with SLA timers to named operators
  • Landed-cost analytics per lane, customer and SKU
meridian.app / shipments / MRD-48217
Live · 14s ago
On-time rate
99.4%+1.2
Avg. dwell
3.2h−42%
Open exceptions
4−6
Rotterdam
Jakarta
  1. 09:42
    Origin gate-in · Rotterdam Terminal 8
  2. 14:10
    Loaded on MV Meridian Voyager · CMA-CGM 312W
  3. Mar 04
    Suez Canal transit · on schedule
  4. Mar 11
    Discharged · Jakarta Tanjung Priok
  5. Mar 14
    Customs cleared · last-mile dispatched
05 — Proof in production

Outcomes, not anecdotes.

All case studies
FMCG · Beverages — case study photograph
Case 01 · FMCG · Beverages

Cut stock-outs by 64% across 1,200 retail doors

Problem

A regional beverage brand was missing 11% of weekly delivery windows during peak demand, eroding shelf availability and trade-promo ROI.

Solution

Replaced 4 fragmented carriers with a single dedicated fleet, dynamic routing, and forward-stocked micro-warehouses in 6 metros.

−64%
stock-out events
+32%
on-time delivery
−18%
cost per case
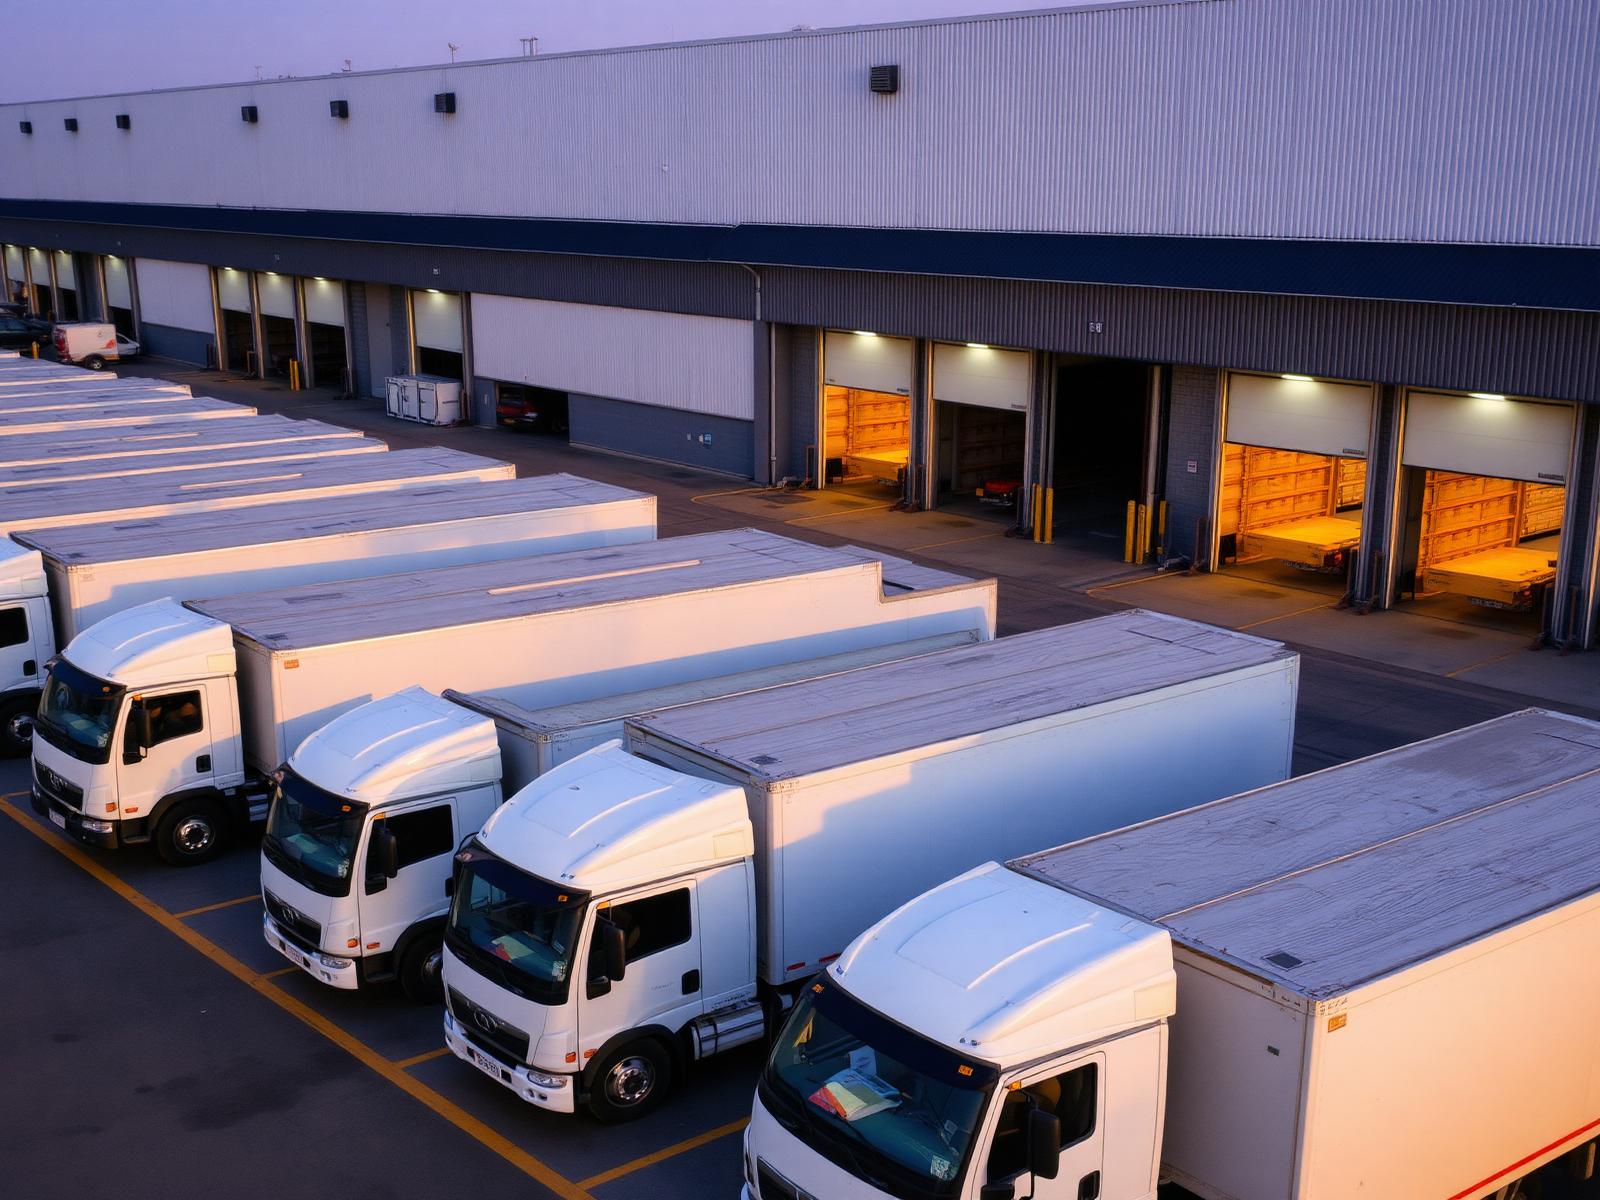
Manufacturing · Electronics — case study photograph
Case 02 · Manufacturing · Electronics

Compressed inbound lead time from 41 → 23 days

Problem

Components from 9 origin ports arrived inconsistently, forcing 22 days of buffer inventory and frequent line stoppages.

Solution

Consolidated to 2 hub ports with weekly direct sailings, pre-cleared customs, and bonded warehousing 3km from the plant.
−44%
lead time
−$2.1M
annual inventory cost
0
line stoppages YTD
E-commerce · Cross-border — case study photograph
Case 03 · E-commerce · Cross-border

Same-day in 14 cities without burning margin

Problem

A cross-border D2C brand was losing 9% of cart conversions to slow shipping promises in SEA.

Solution

Forward inventory model into 3 in-country fulfilment centres, last-mile via Meridian fleet with fixed per-parcel pricing.

+19%
checkout conversion
−27%
cost per parcel
4.8h
median delivery
06 — How engagements run

From scoping call to first measured improvement in 30 days.

See full methodology
  1. Step 01
    Requirement analysis

    Lane audit, SKU profile, SLA targets, current cost baseline.

  2. Step 02
    Route & cost optimization

    Modal mix, carrier selection, forward-stock modelling.

  3. Step 03
    Execution

    Onboarded operators, instrumented assets, first shipment in 14 days.

  4. Step 04
    Tracking & monitoring

    Live GPS, IoT, exceptions auto-routed to named owners.

  5. Step 05
    Reporting

    Monthly on-time, landed cost, CO₂ and savings vs baseline.

07 — Start the conversation

Tell us your worst lane.
We will quote the fix in 72 hours.

Send us your three highest-friction lanes and current cost. You will receive a no-fee audit, a side-by-side cost comparison, and a measurable SLA proposal — signed by the operator who will run your account.

99.4%
On-time, rolling 30 days
0.04%
Damage rate, 36-month avg
142
Ports & terminals